Texas New Home Sales Report: October 2026 Charts
Texas new home sales averaged 5,018 in October 2026, down 7.6% from October 2025. The average sale price fell 2.9% to $415,948, and pending sales fell 12.8% to 5,119. All figures are three-month moving averages.
These are the October 2026 charts for the HomesUSA.com Texas New Home Sales Report. They cover new homes in Austin, Dallas-Fort Worth, Houston and San Antonio across six measures: sales, days on market, sale price, sales-to-list-price ratio, pending sales and active listings. Each chart has its own link, so it can be opened, shared or cited on its own.
October at a glance
| Measure | Oct. 2026 | Sept. 2026 | Oct. 2025 | Change from Oct. 2025 |
|---|---|---|---|---|
| New home sales | 5,018 | 5,221 | 5,430 | −7.6% |
| Days on market | 109 | 108 | 113 | −4 days |
| Sale price | $415,948 | $419,016 | $428,309 | −2.9% |
| Sales-to-list-price ratio | 97.87% | 97.81% | 96.55% | +1.32 pts |
| Pending sales | 5,119 | 5,465 | 5,873 | −12.8% |
| Active listings | 37,093 | 37,056 | 37,909 | −2.2% |
New home sales
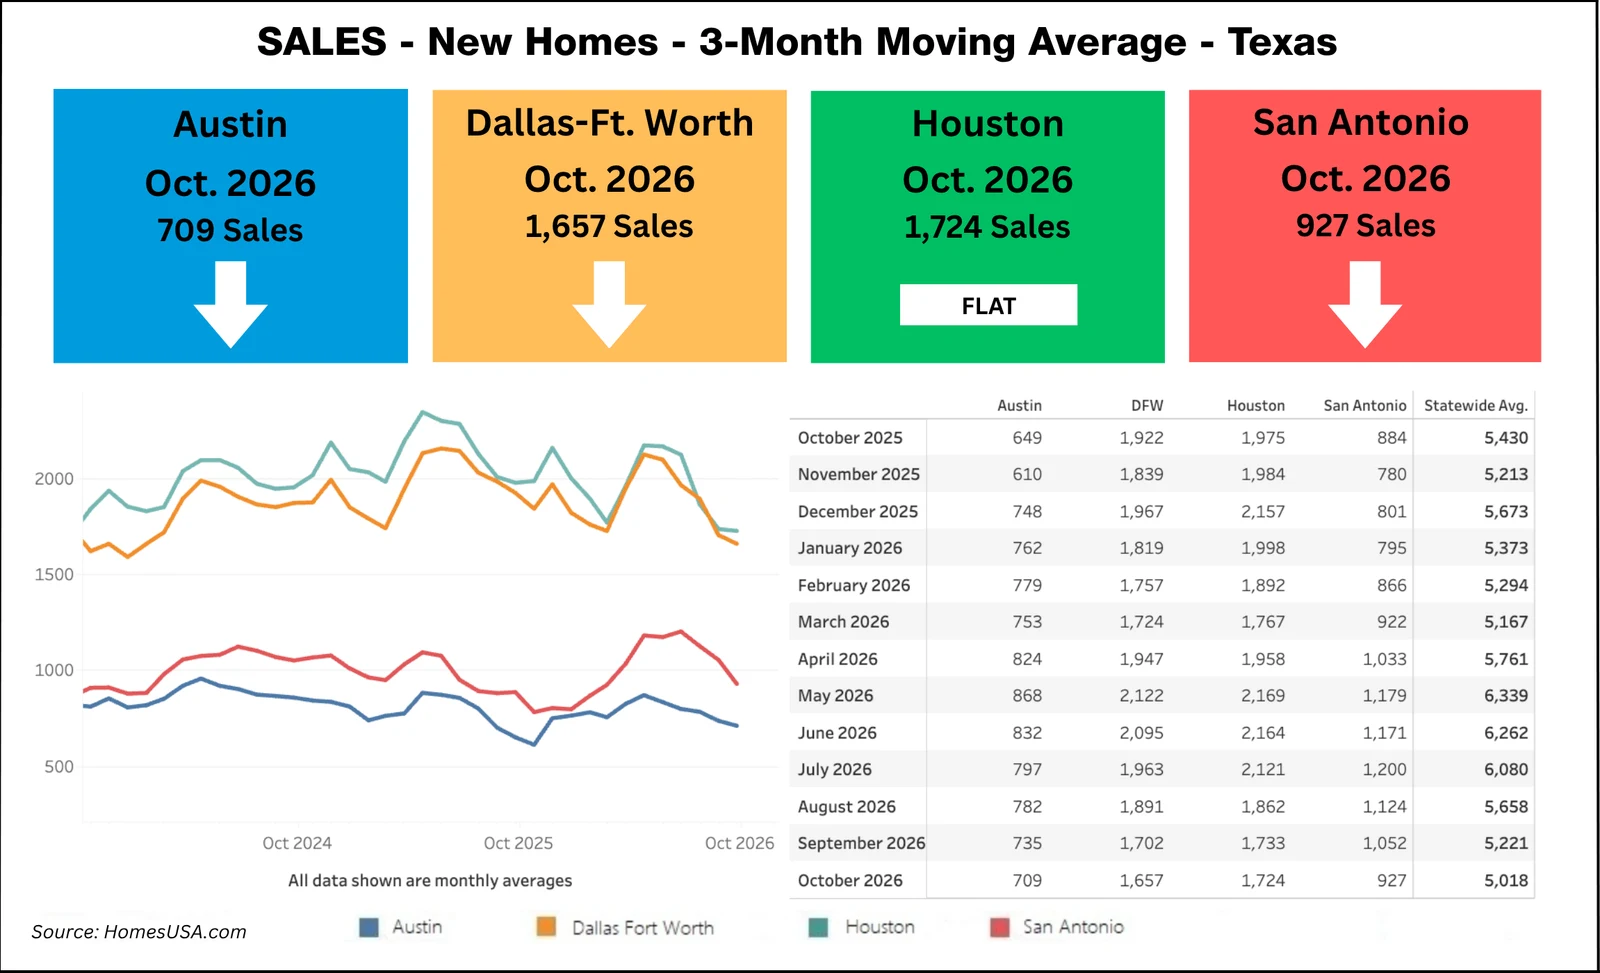
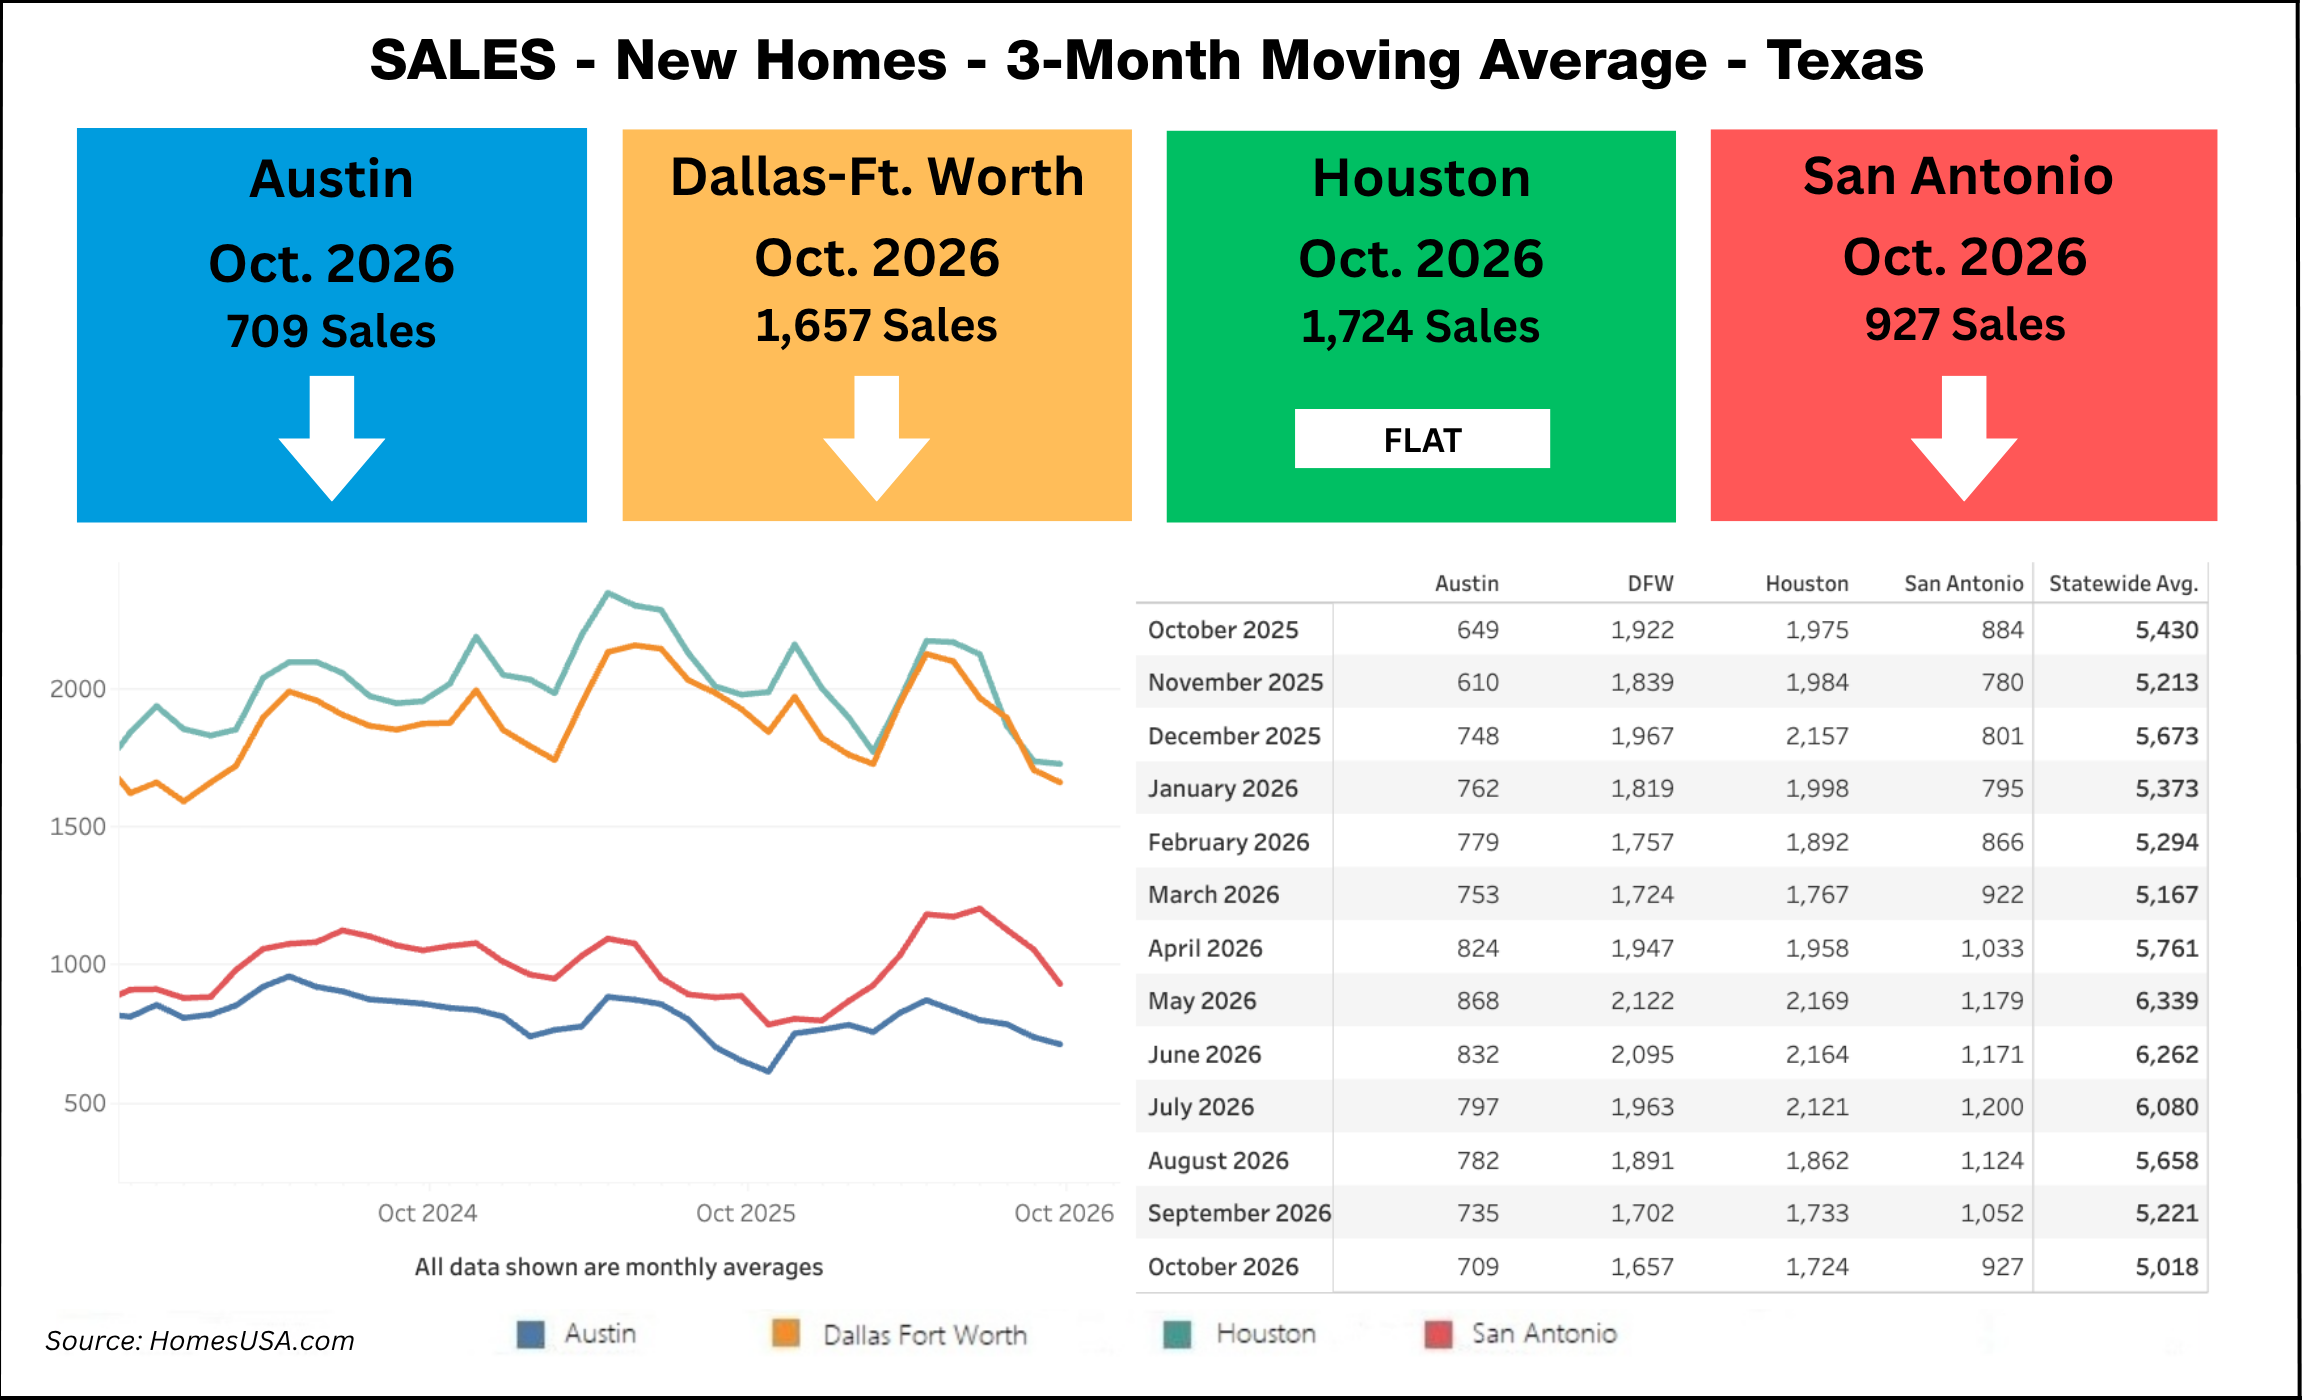
The three-month moving average of new home sales statewide was 5,018 in October, compared with 5,221 in September and 5,430 in October 2025. Houston recorded 1,724 sales, Dallas-Fort Worth 1,657, San Antonio 927 and Austin 709.
Days on market
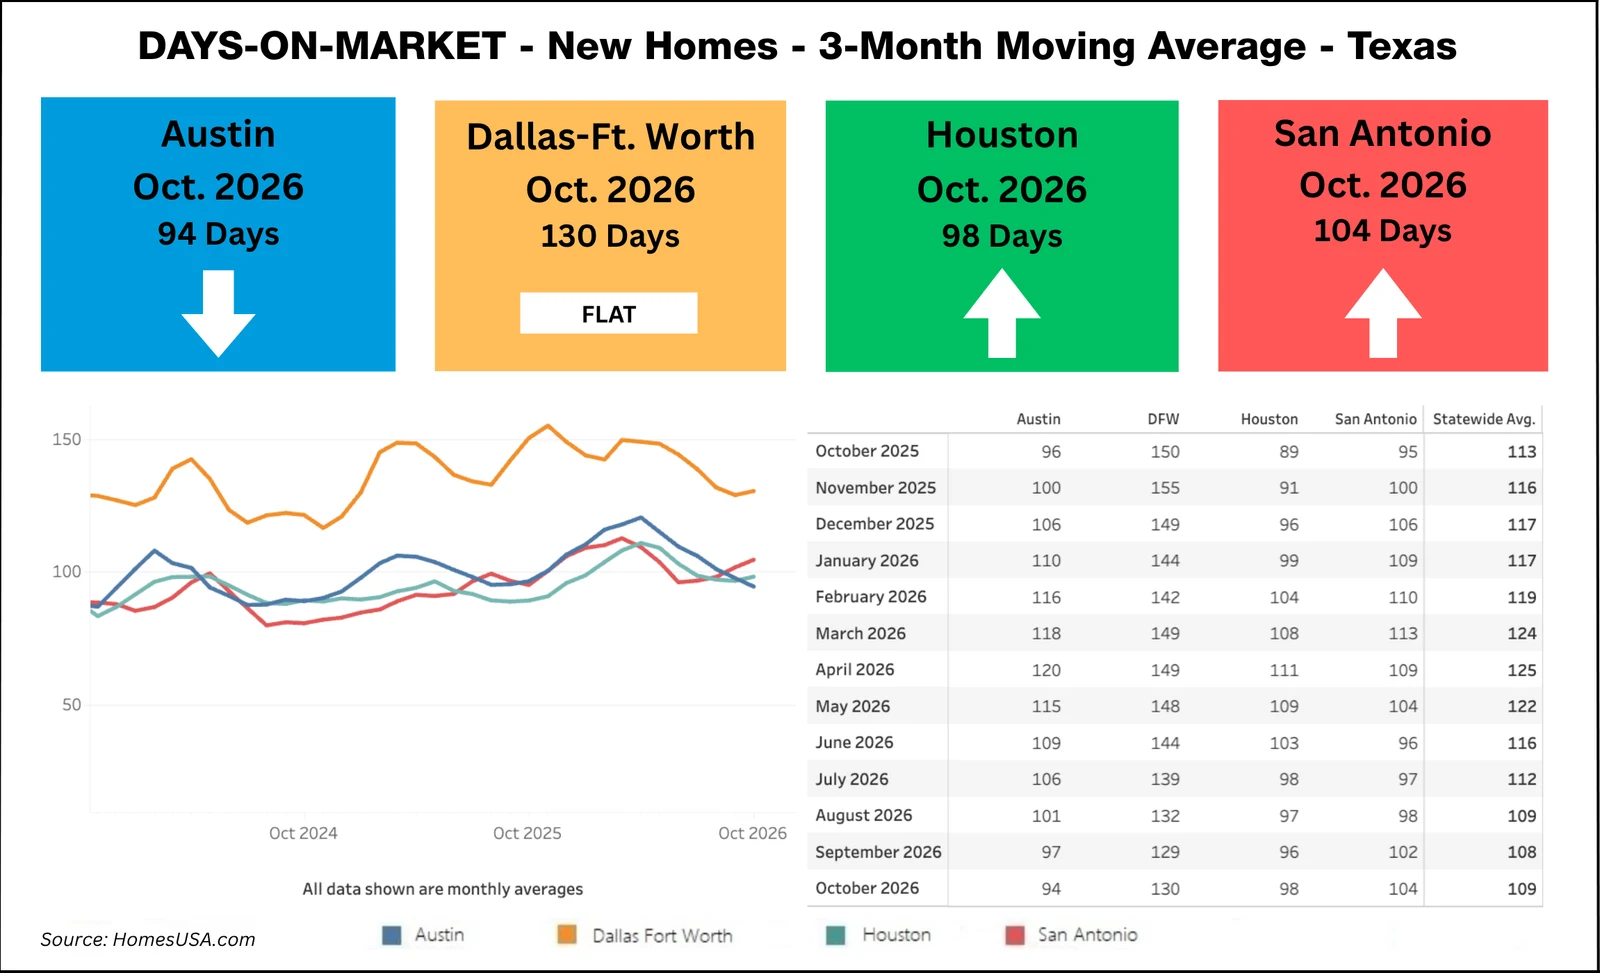
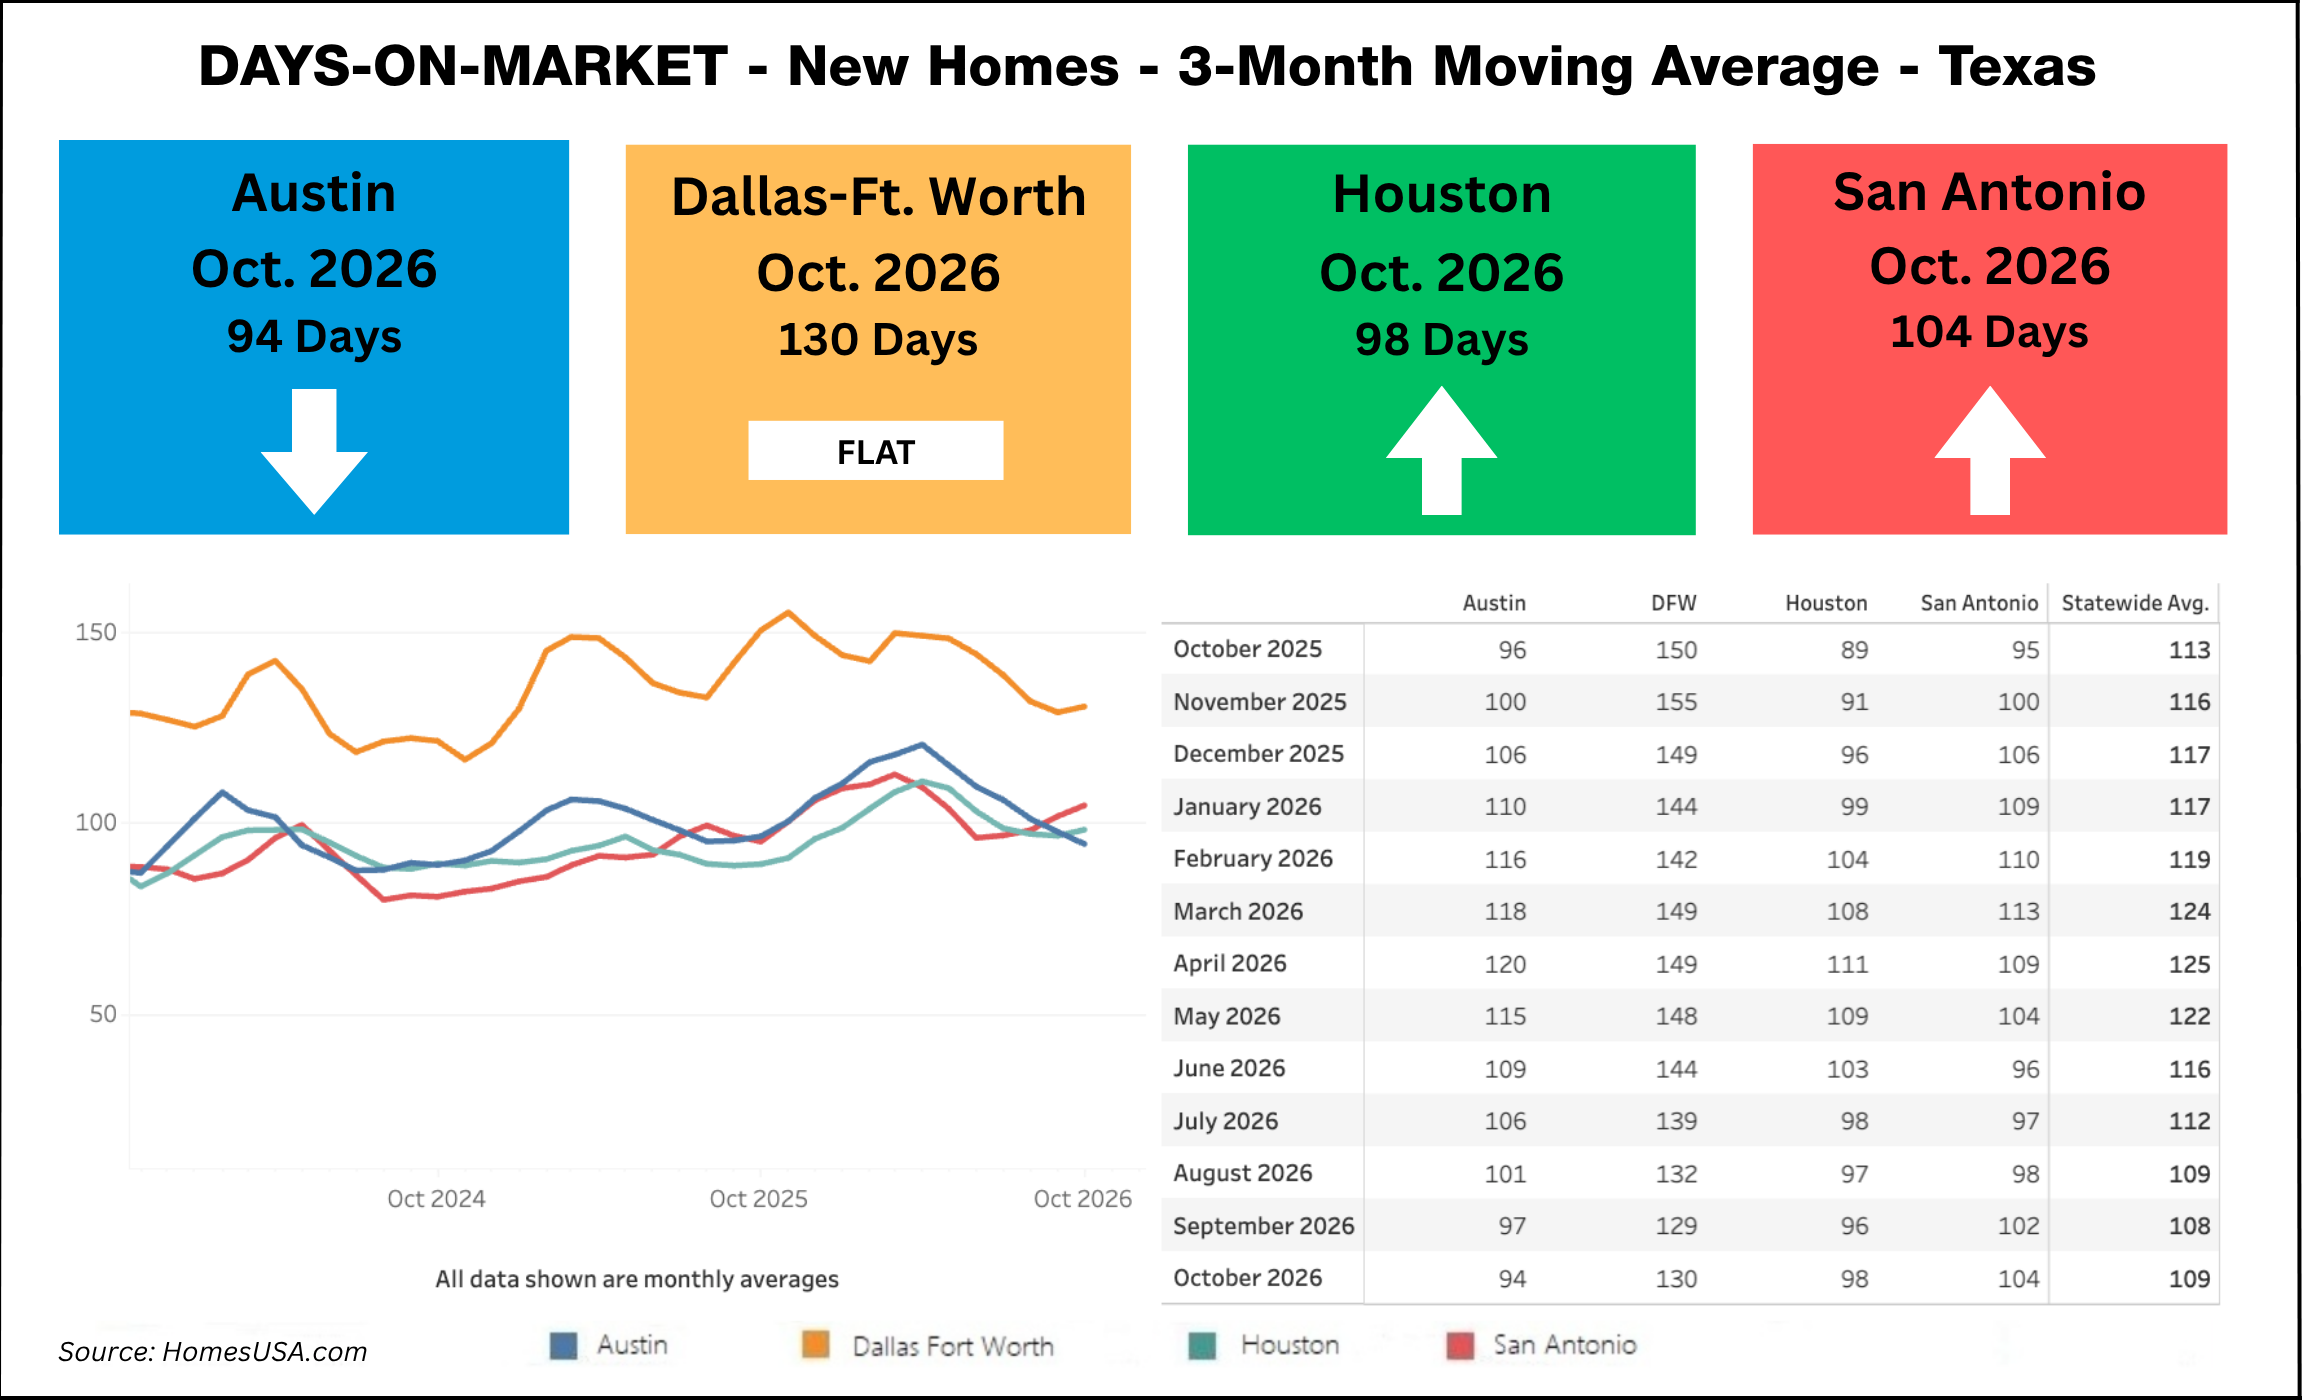
New homes statewide averaged 109 days on market in October, compared with 108 in September and 113 a year earlier. Dallas-Fort Worth averaged 130 days, San Antonio 104, Houston 98 and Austin 94.
Sale price
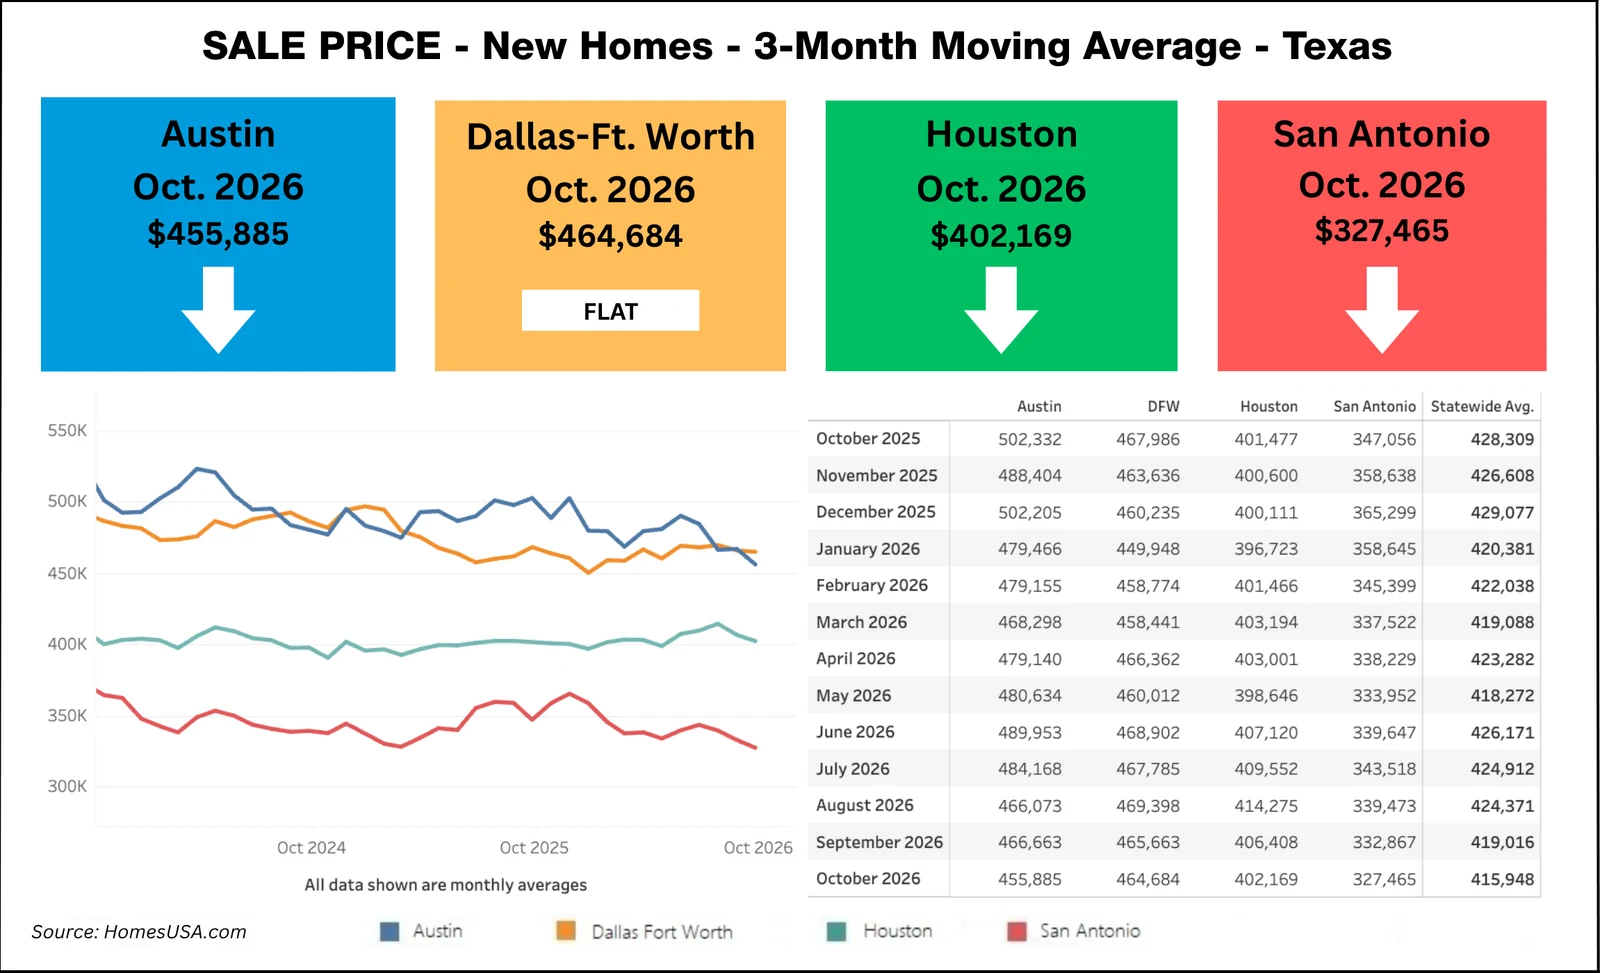
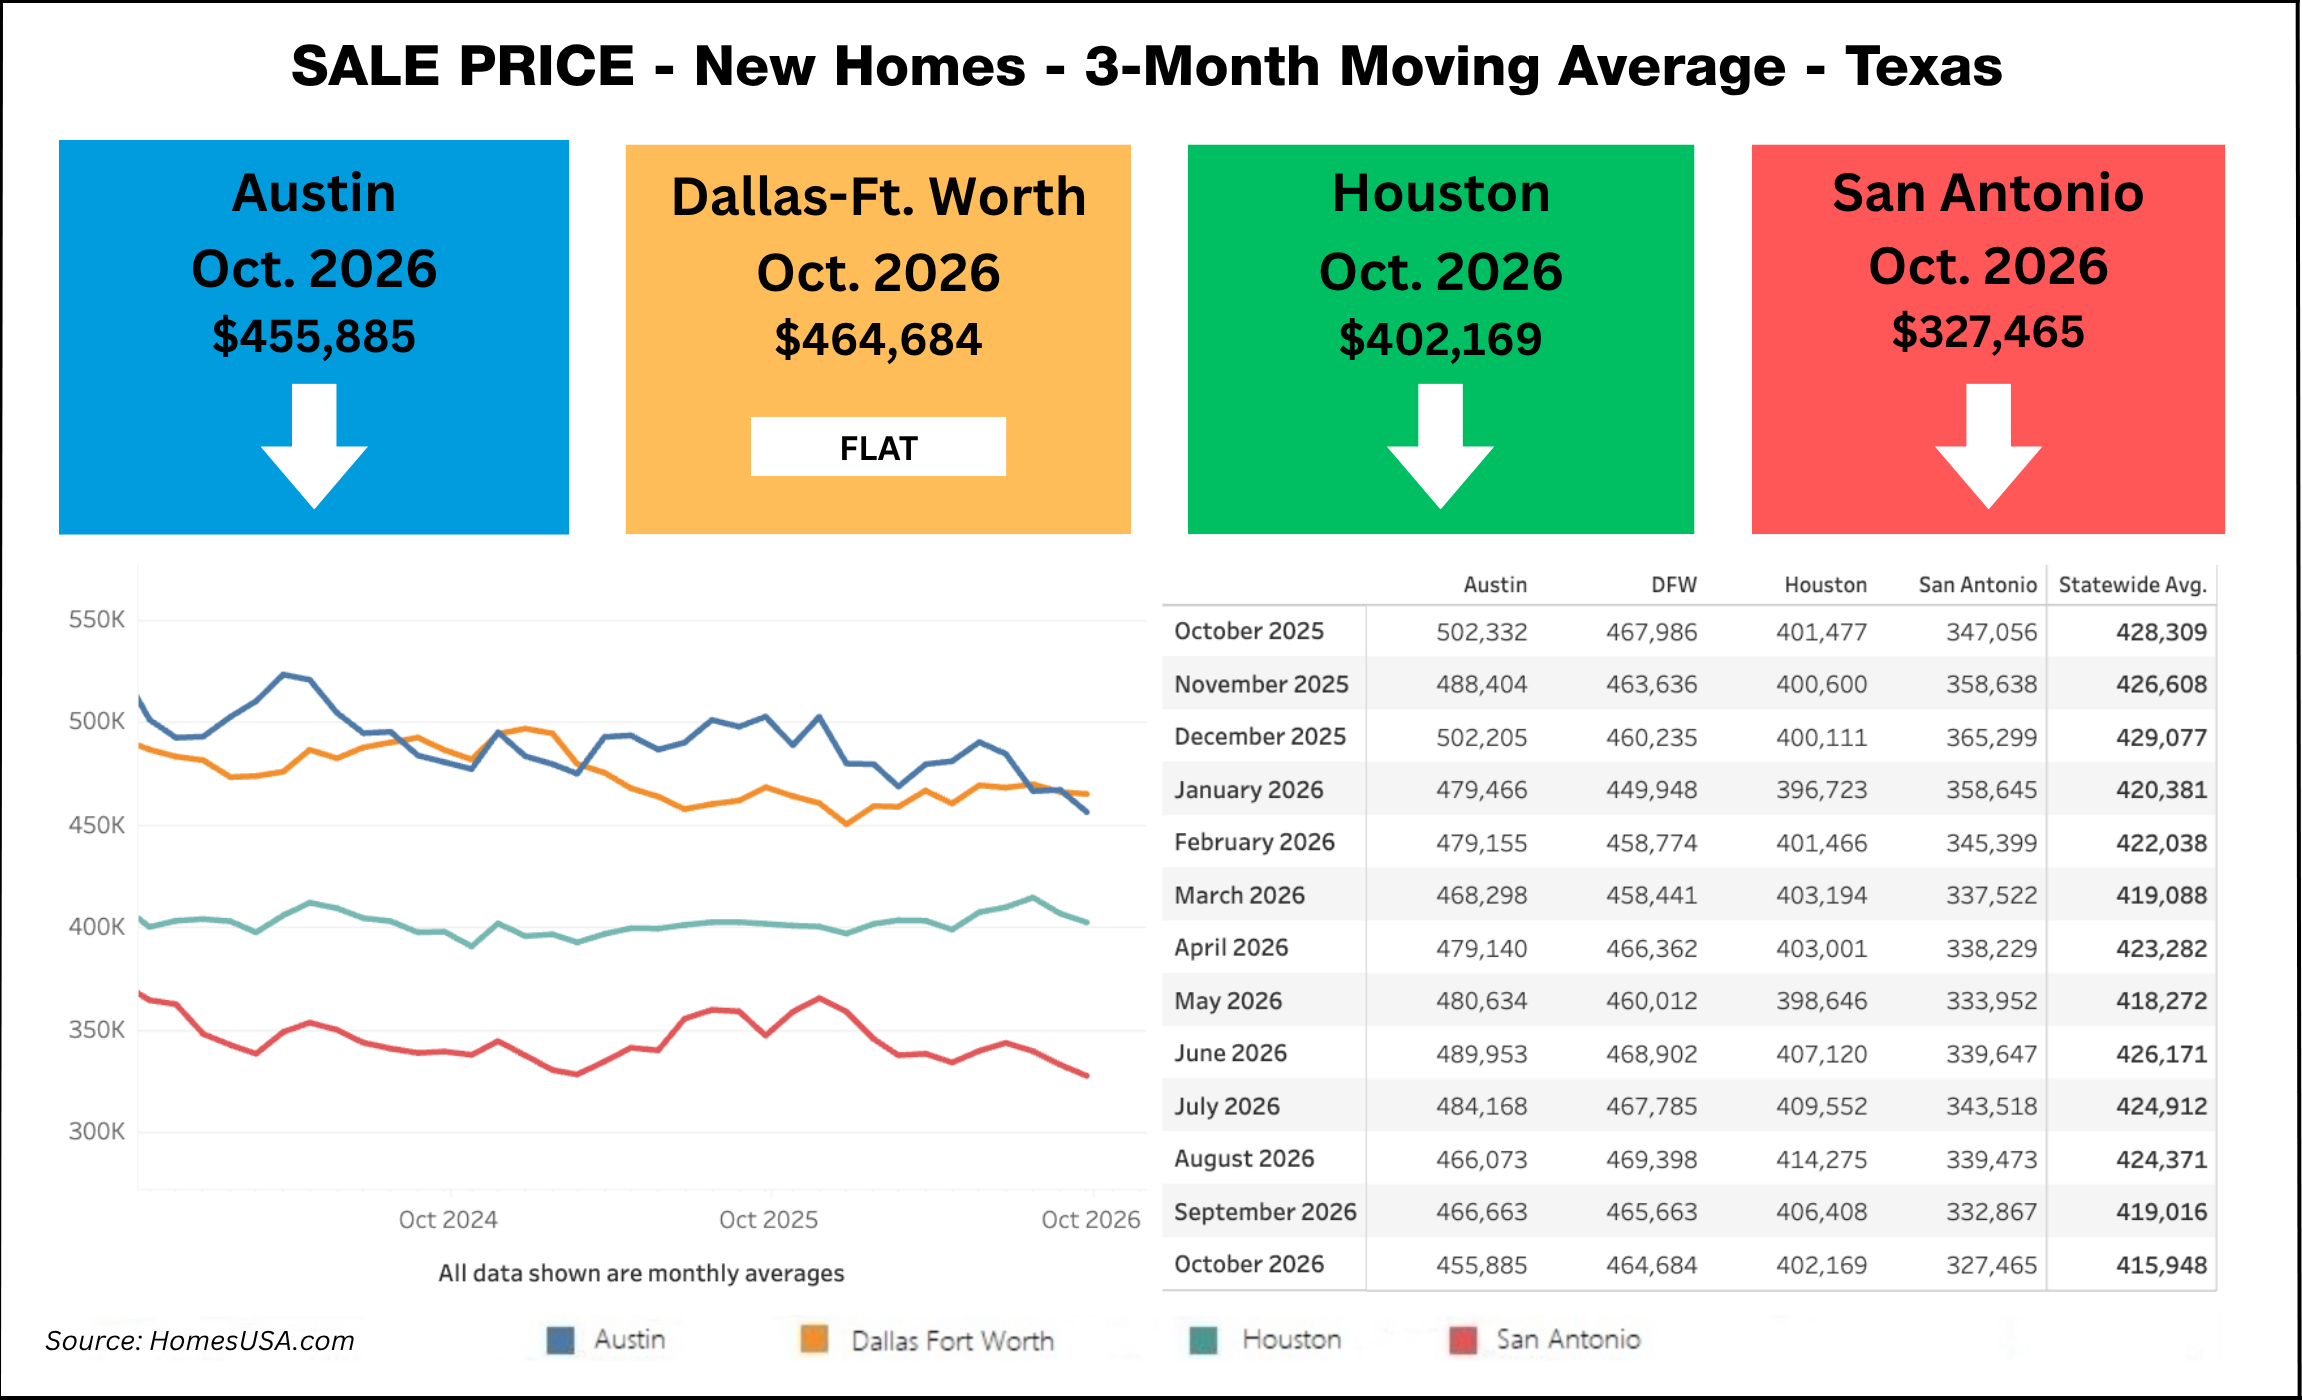
The statewide average new home sale price was $415,948 in October, compared with $419,016 in September and $428,309 in October 2025. Dallas-Fort Worth averaged $464,684, Austin $455,885, Houston $402,169 and San Antonio $327,465.
Sales-to-list-price ratio
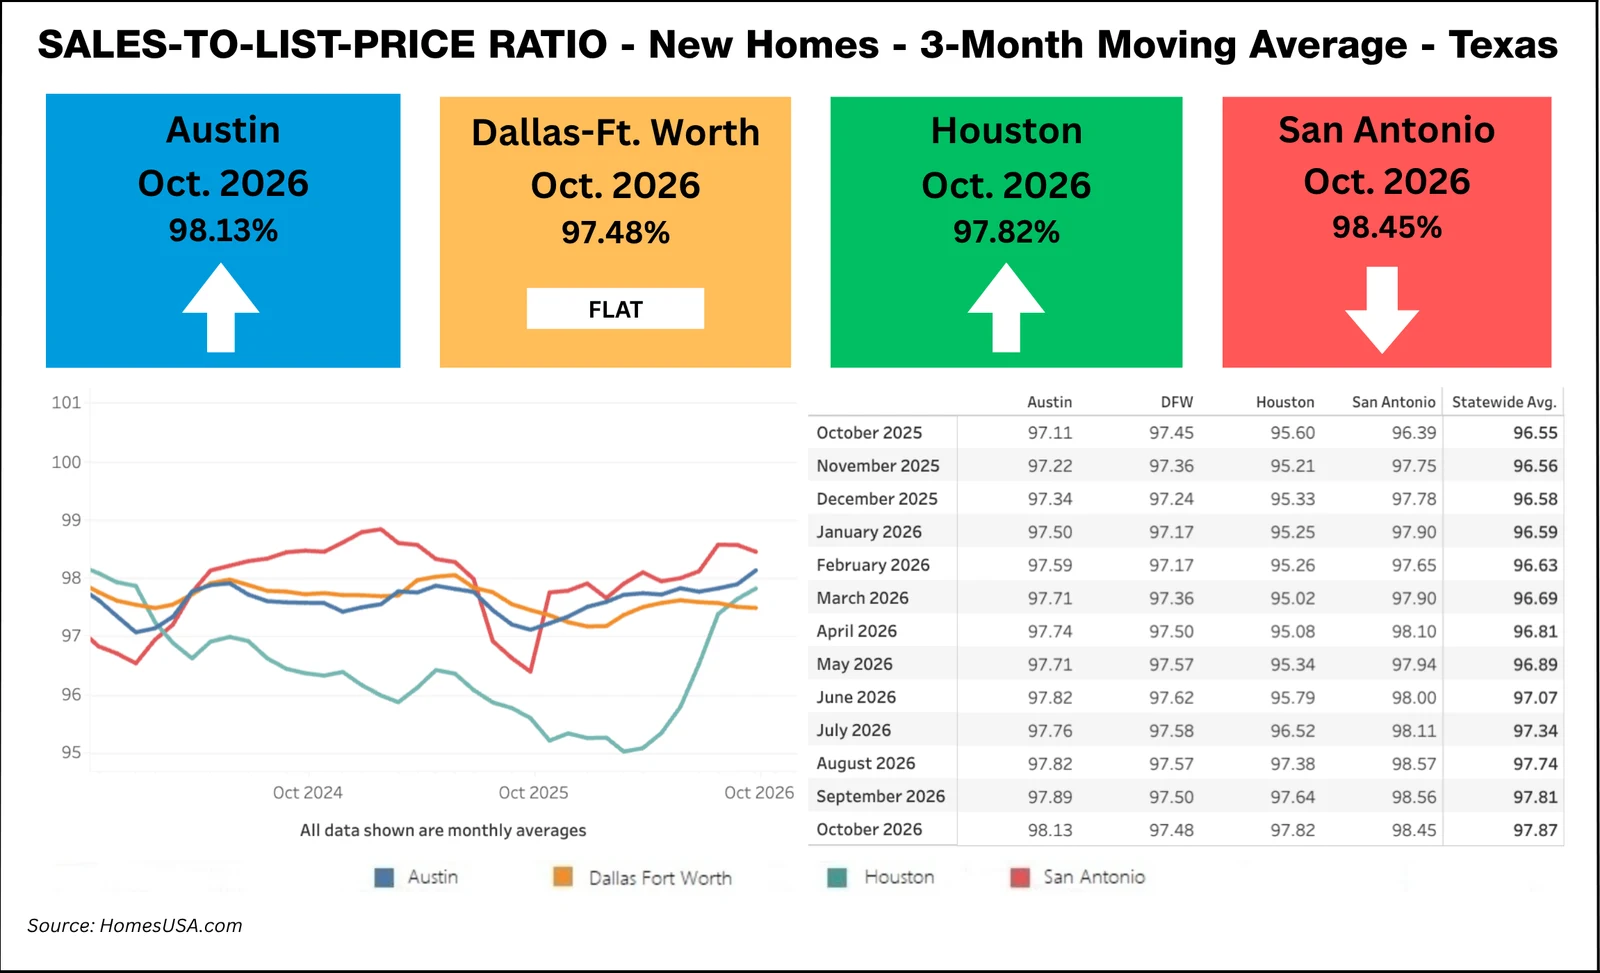
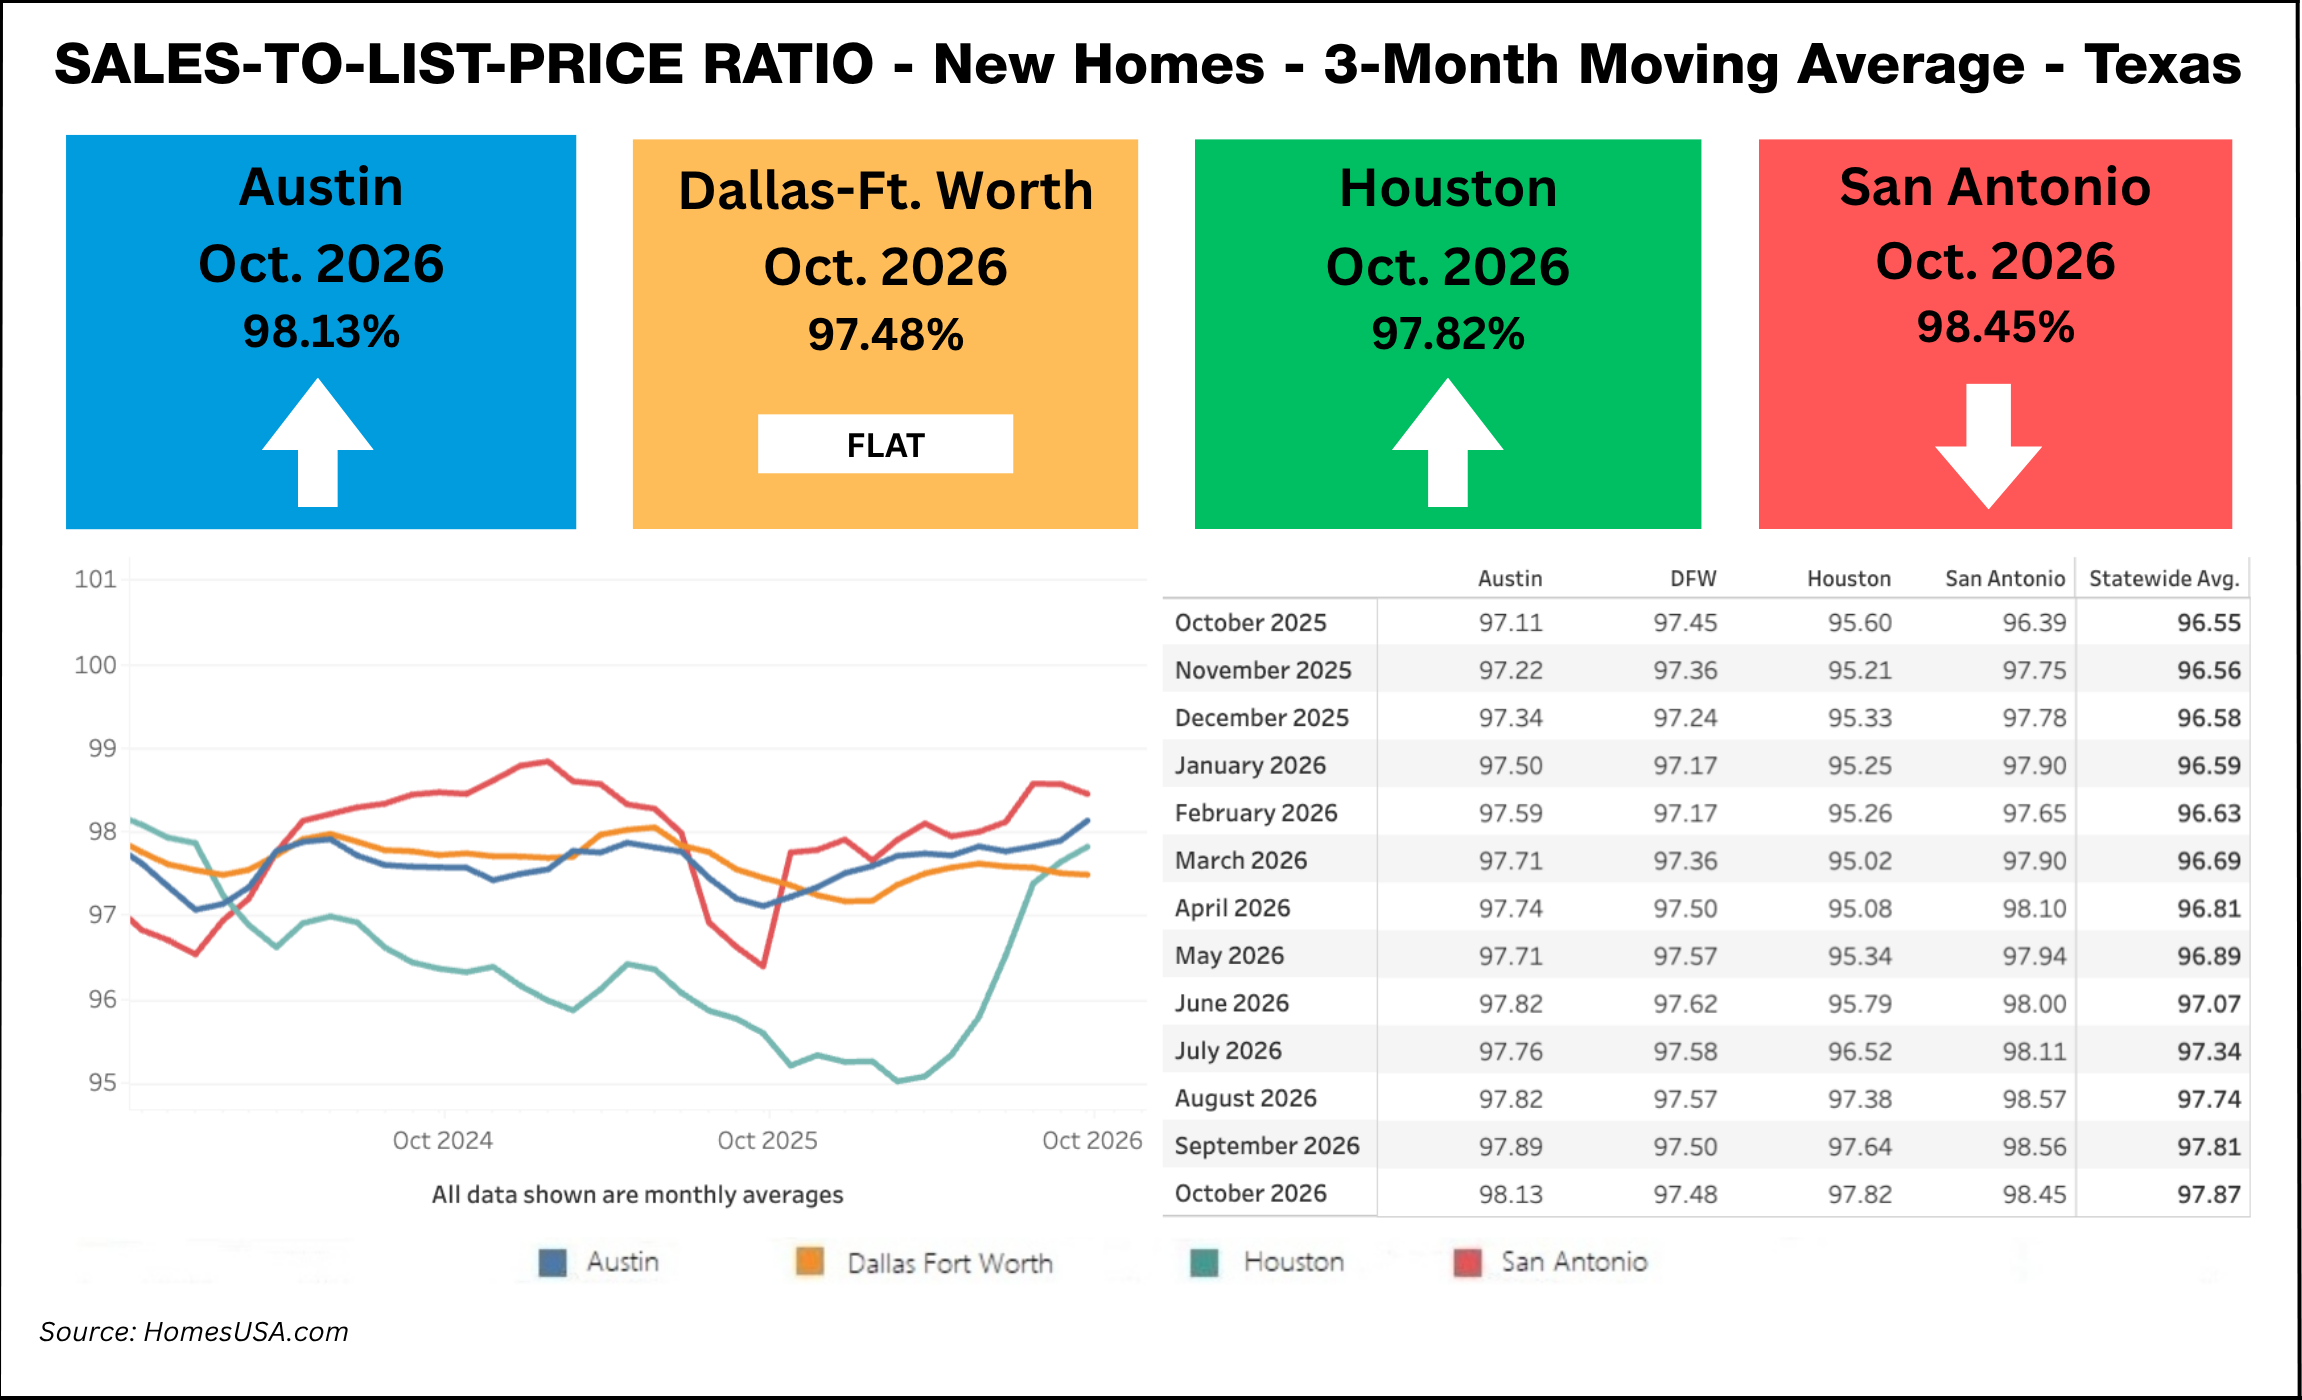
New homes statewide sold for 97.87% of list price in October, compared with 97.81% in September and 96.55% in October 2025. San Antonio’s ratio was 98.45%, Austin’s 98.13%, Houston’s 97.82% and Dallas-Fort Worth’s 97.48%.
Pending sales
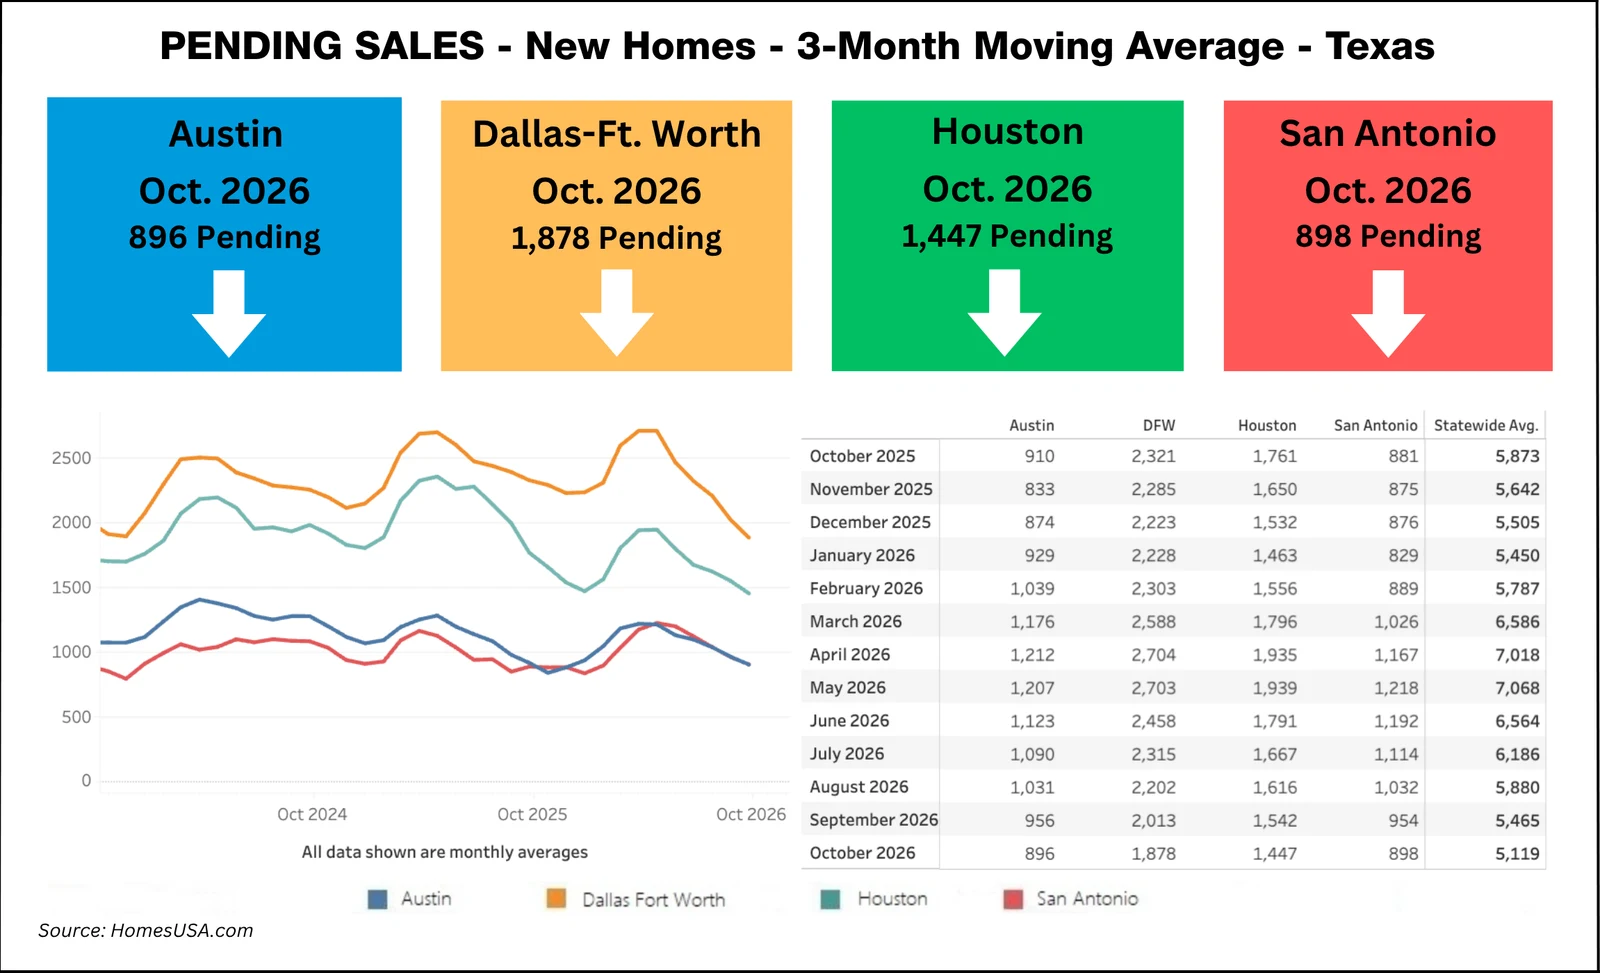
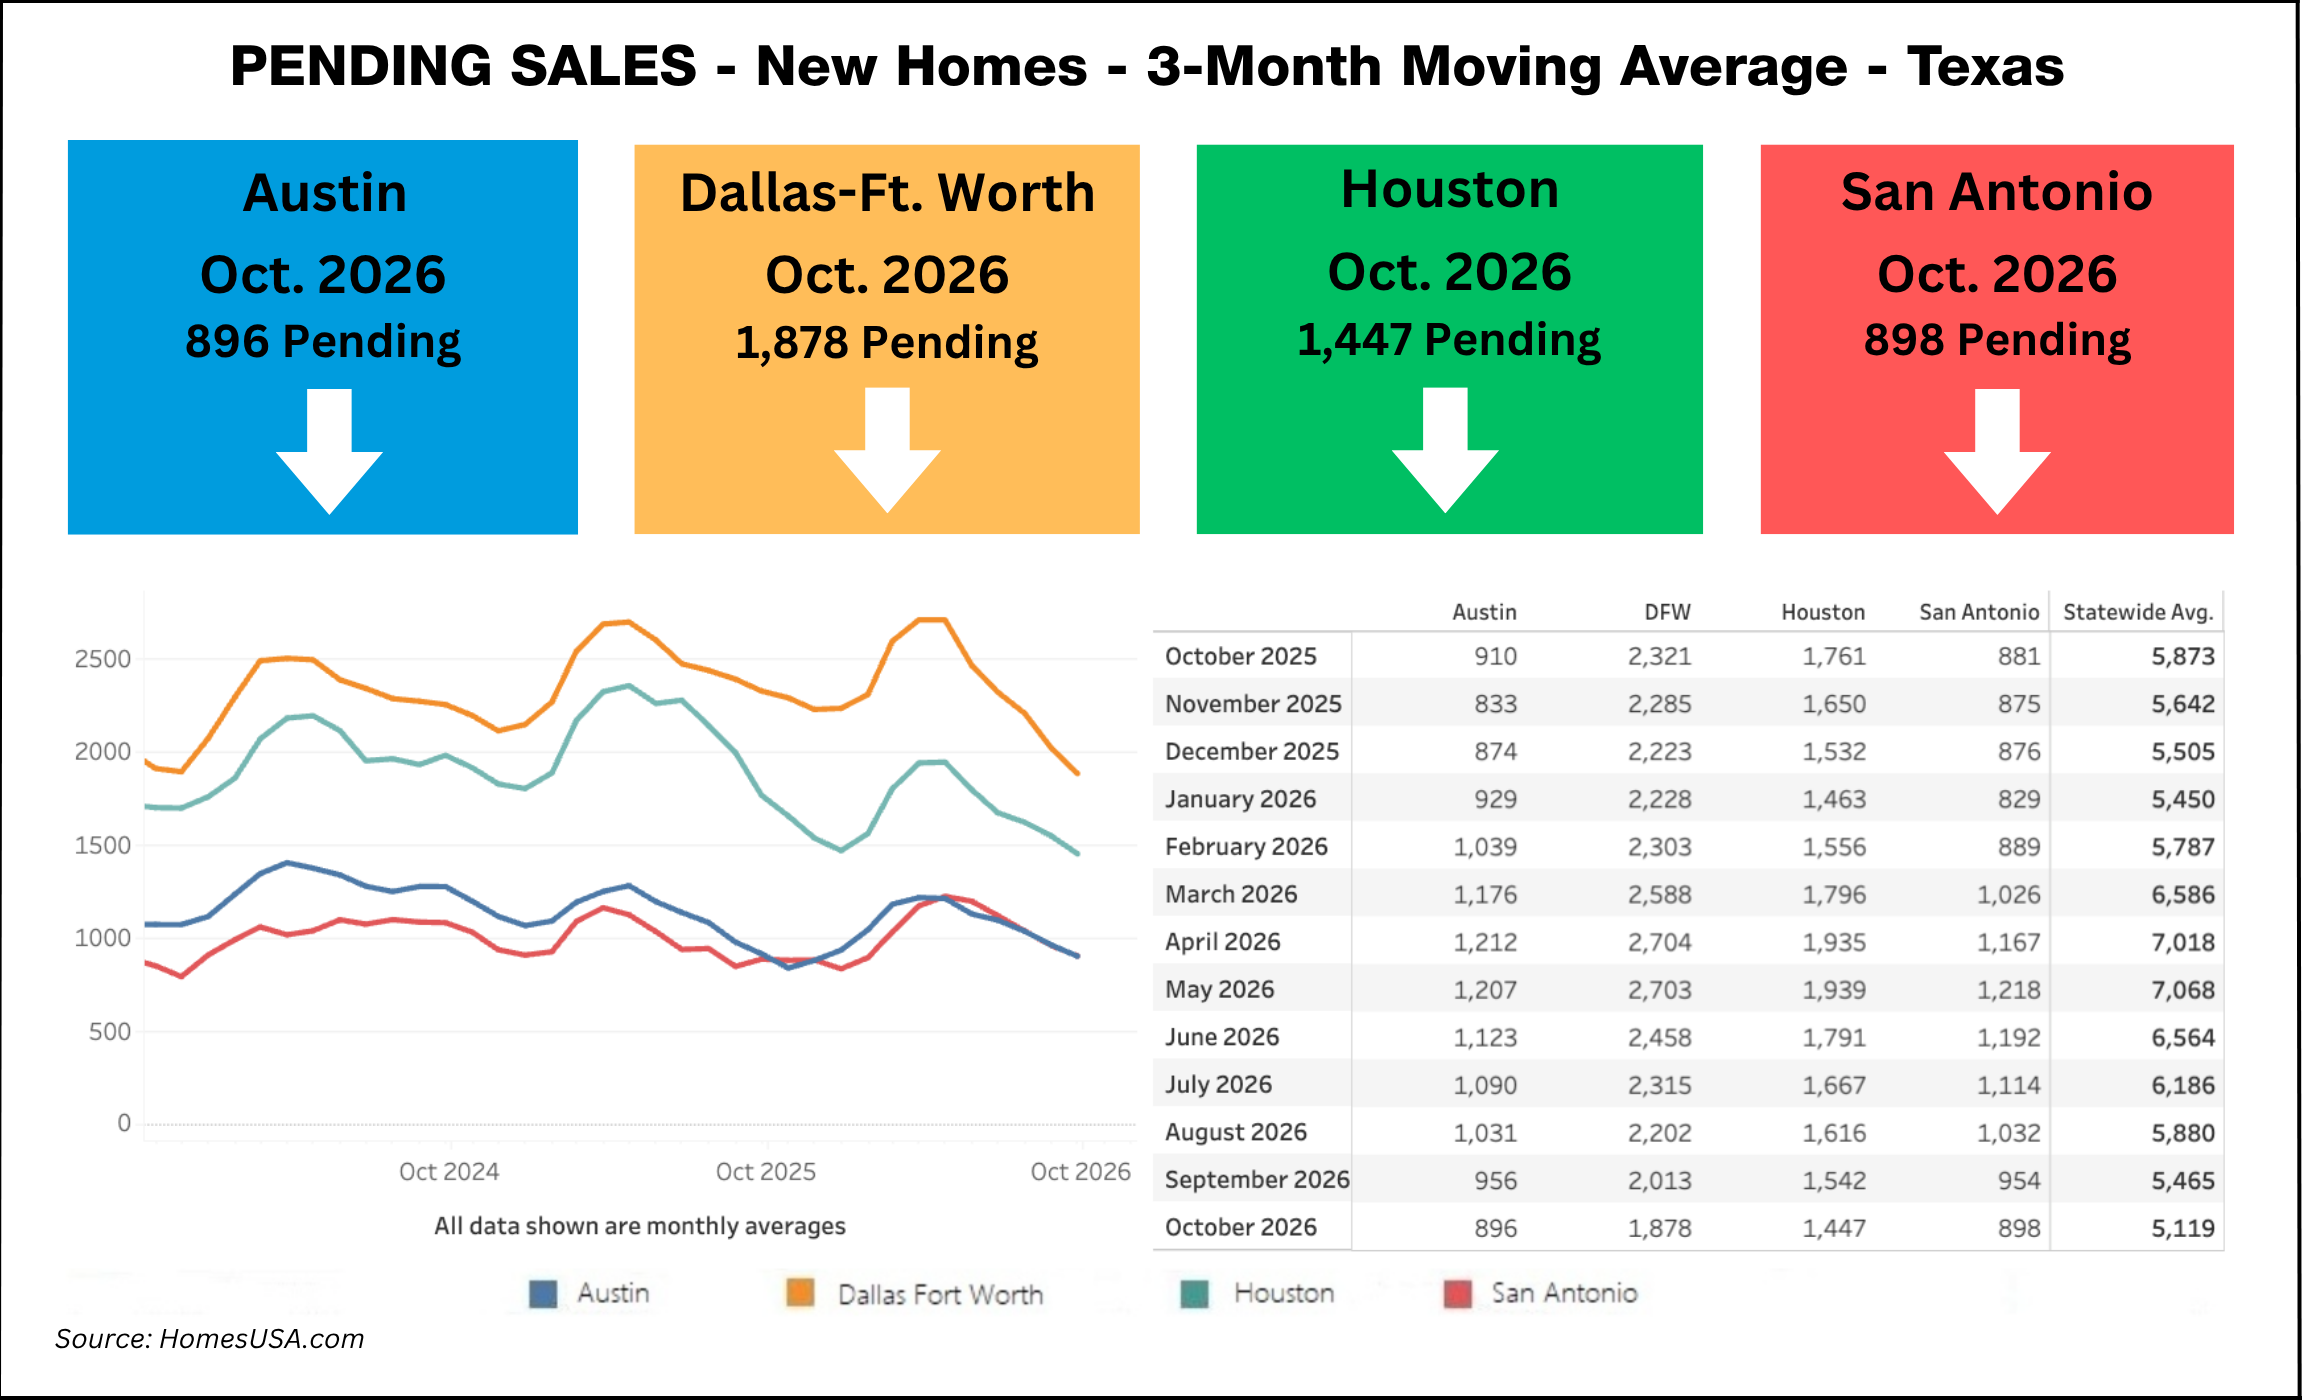
Pending new home sales statewide averaged 5,119 in October, compared with 5,465 in September and 5,873 in October 2025. Dallas-Fort Worth had 1,878 pending sales, Houston 1,447, San Antonio 898 and Austin 896.
Active listings
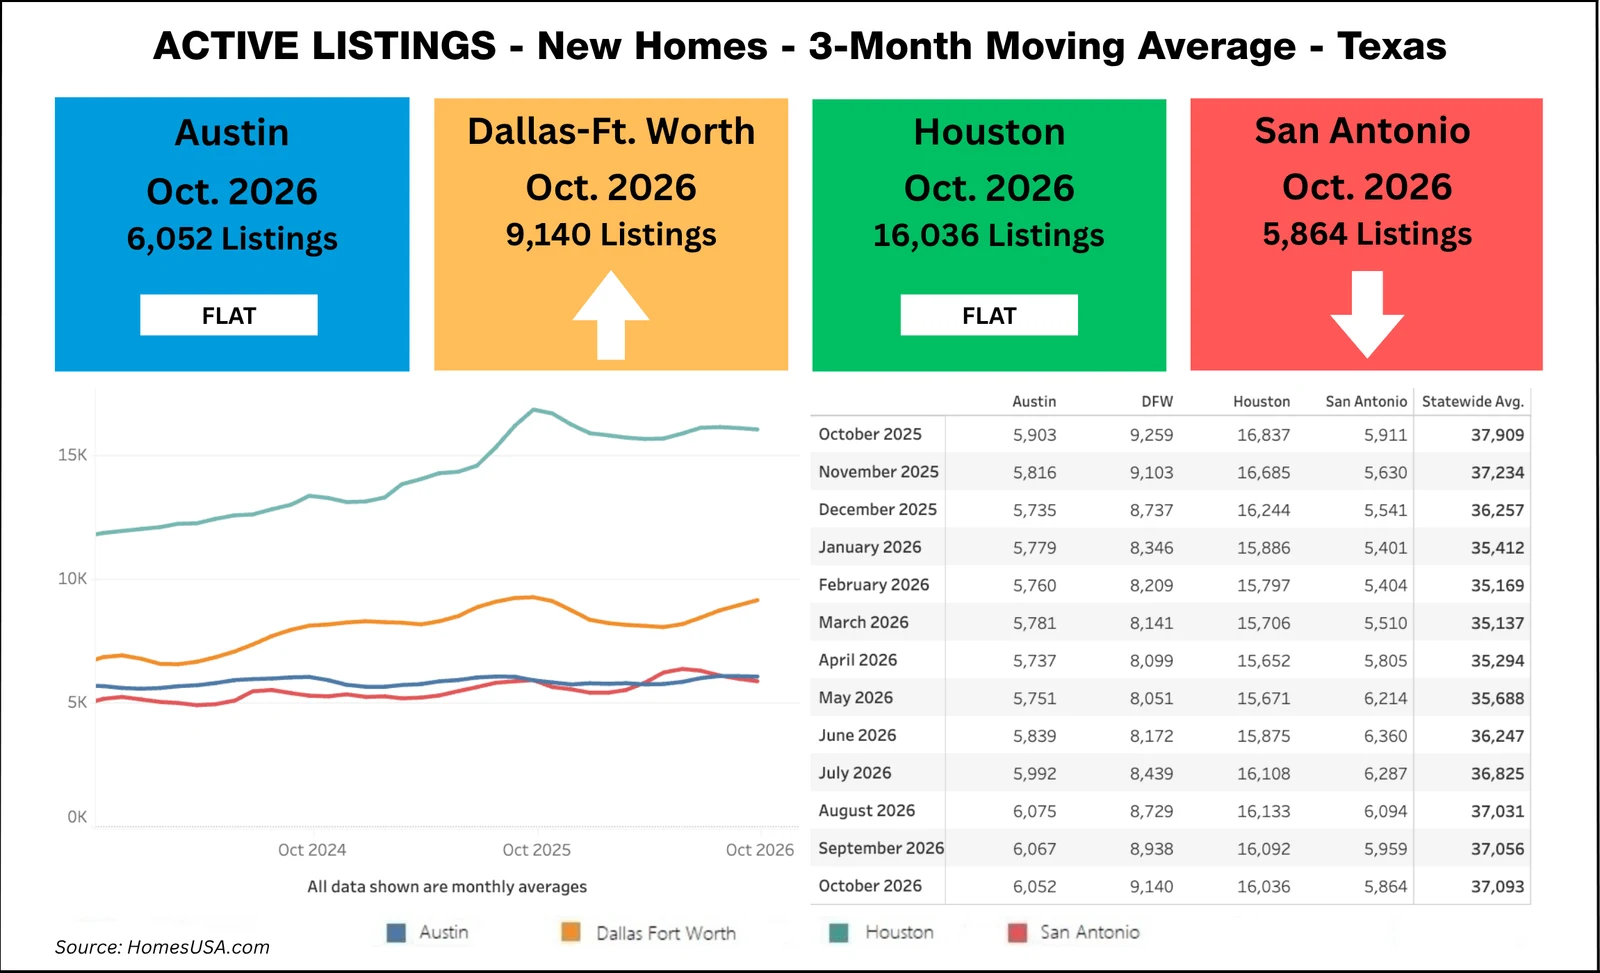
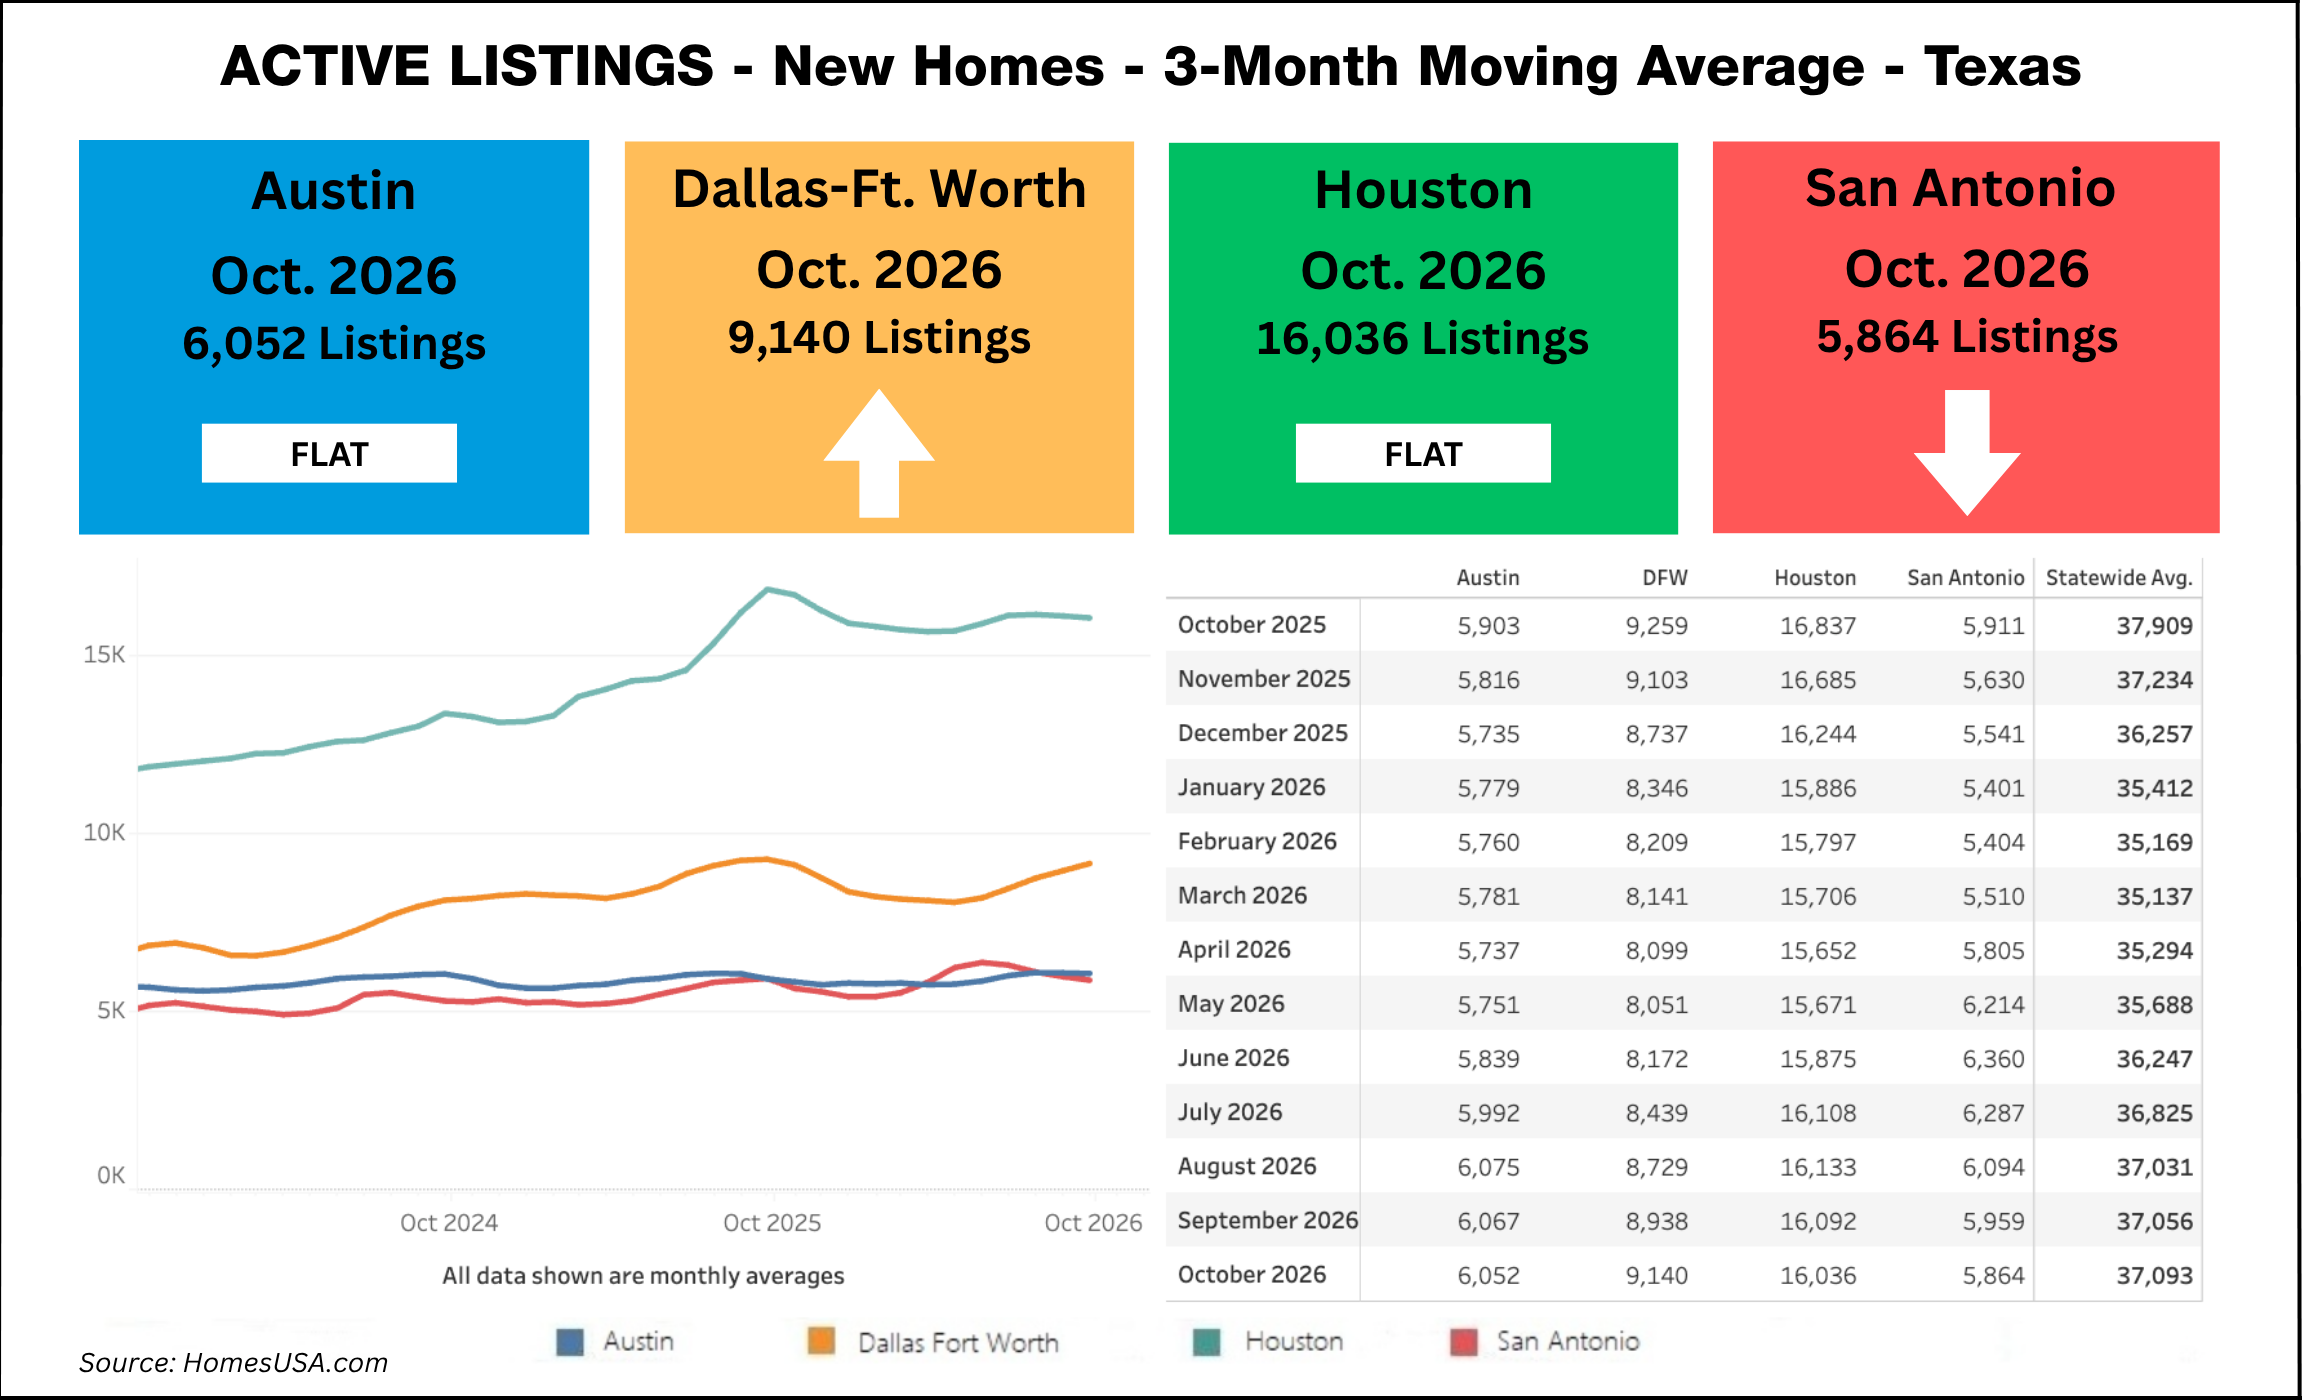
Active new home listings statewide averaged 37,093 in October, compared with 37,056 in September and 37,909 in October 2025. Houston had 16,036 active listings, Dallas-Fort Worth 9,140, Austin 6,052 and San Antonio 5,864.
12-month moving averages
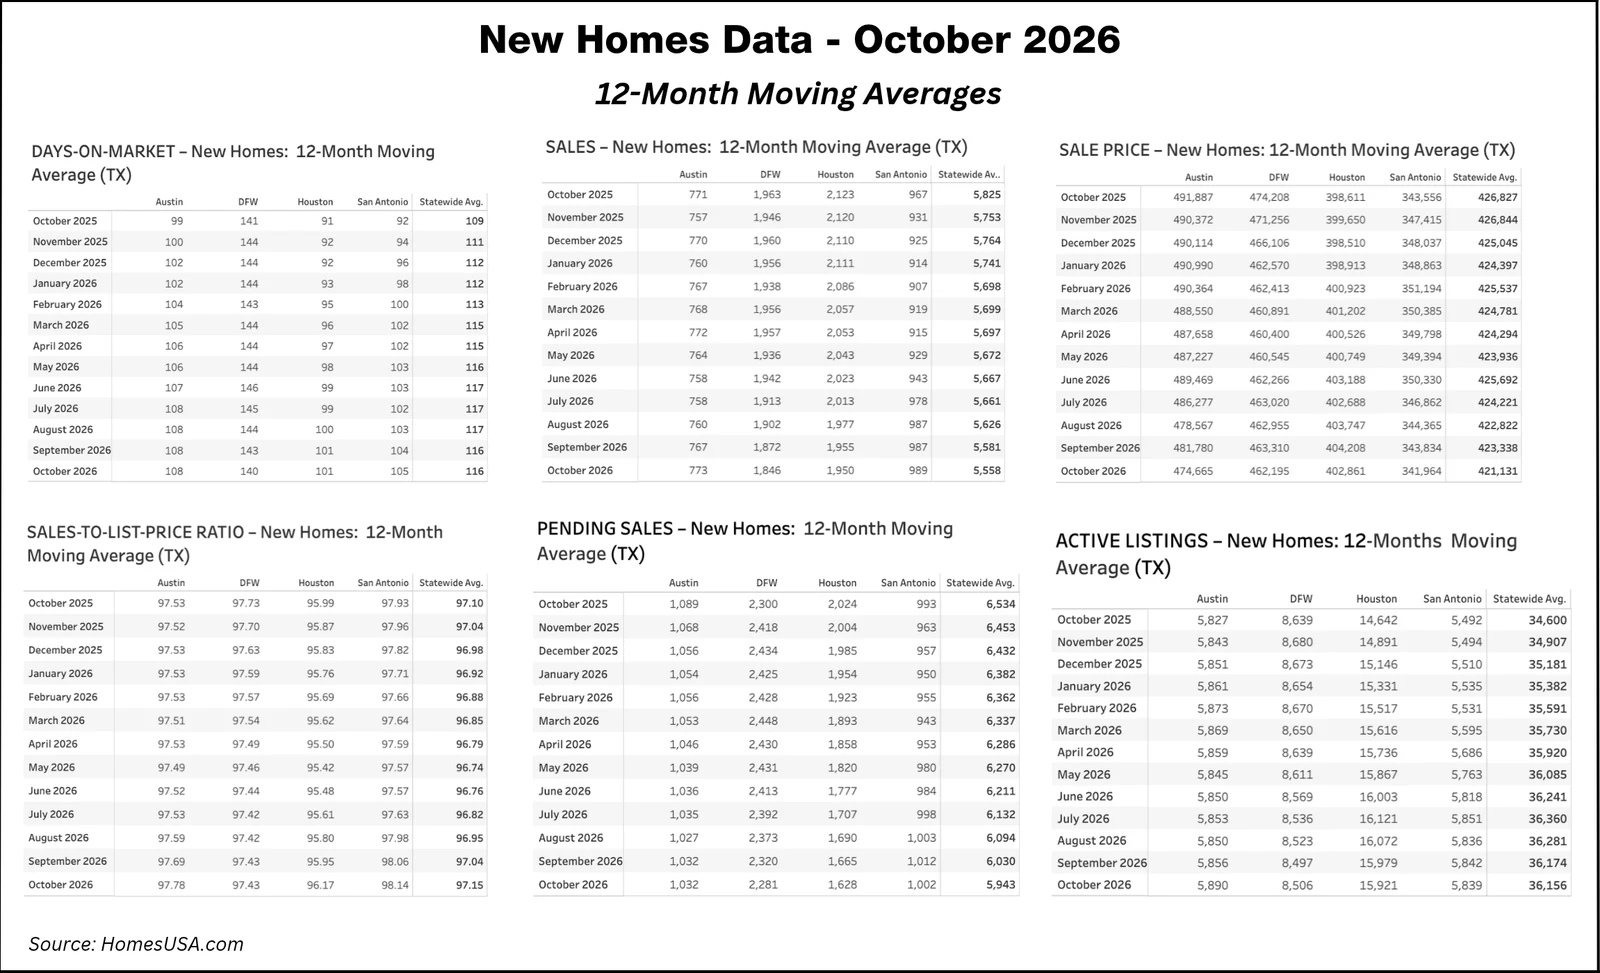
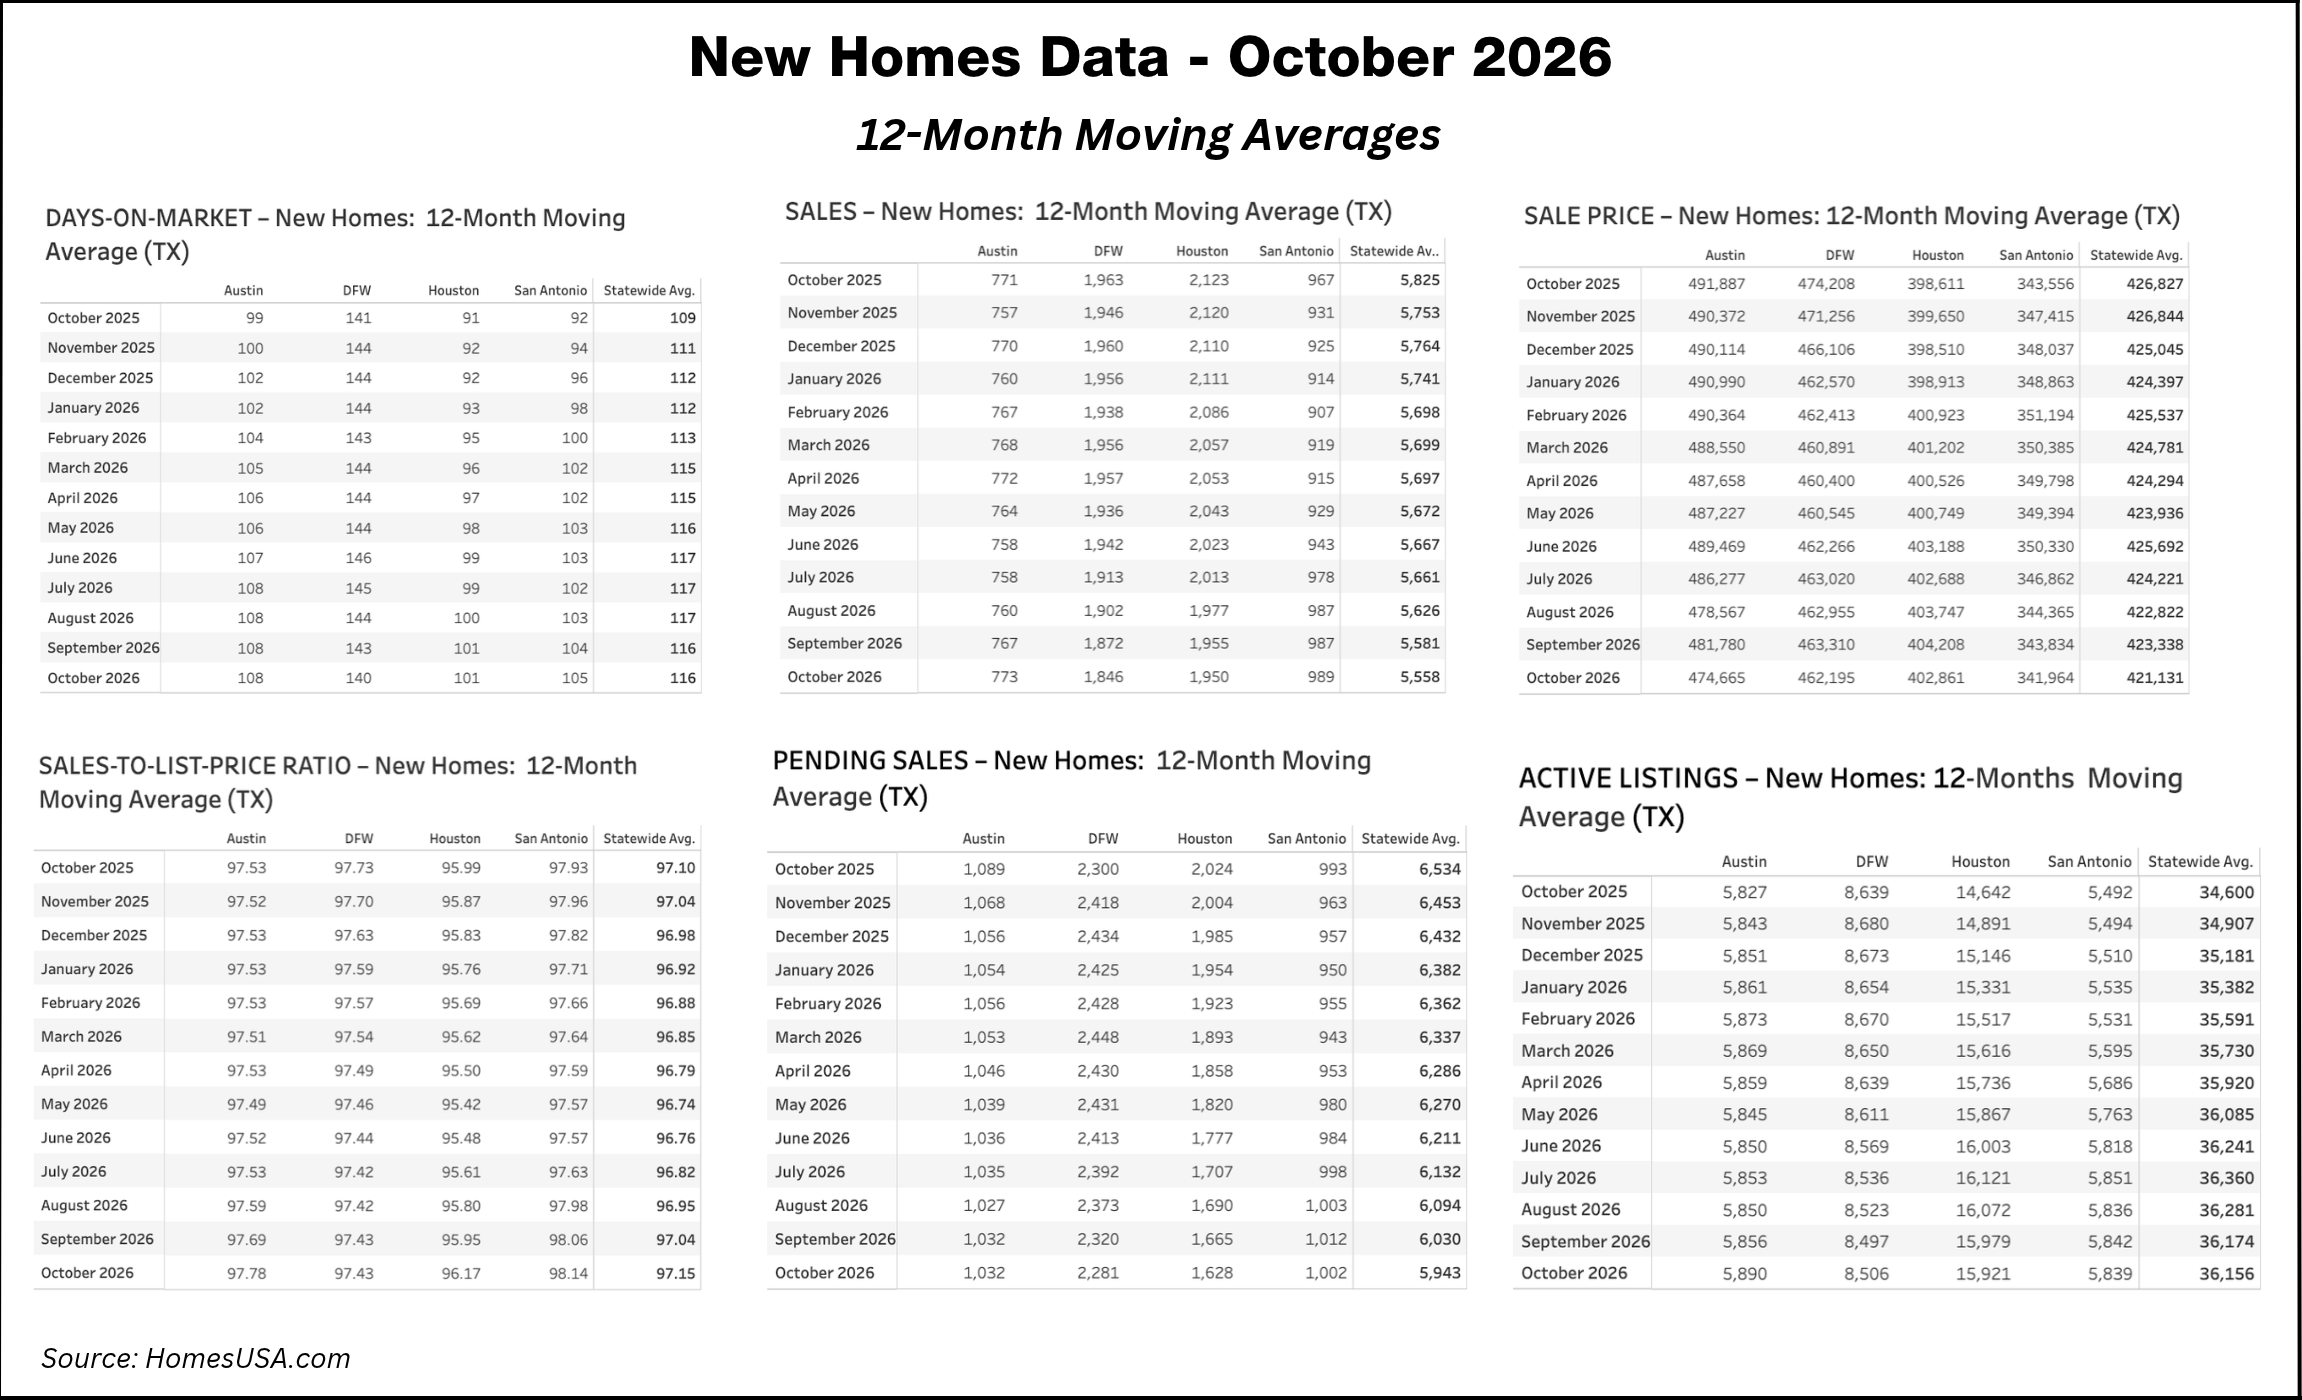
The 12-month moving averages remove seasonality and show the longer trend. For October 2026 the statewide 12-month averages were 5,558 sales, 116 days on market, a $421,131 sale price, a 97.15% sales-to-list-price ratio, 5,943 pending sales and 36,156 active listings.
Direct links to each chart
- New home sales
- Days on market
- Sale price
- Sales-to-list-price ratio
- Pending sales
- Active listings
- 12-month moving averages







About the report
The HomesUSA.com Texas New Home Sales Report uses Multiple Listing Service data from the Realtor associations of North Texas, Houston, Austin and San Antonio. It covers closed sales recorded in those MLSs by the 10th day of the following month and reports three-month and 12-month moving averages for six measures: days on market, sales, sale price, sales-to-list-price ratio, pending sales and active listings. The three-month averages track market seasonality; the 12-month averages remove it and track the longer trend.