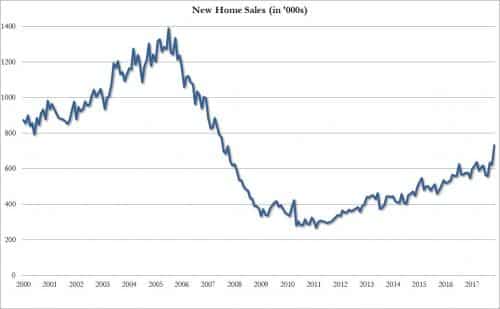
Earlier last week, ZeroHedge discussed that US personal savings tumbled to the lowest since 2007, and now they can also conclude that one of the things Americans splurged on last month was New Homes, because according to the Census on Friday morning, new home sales in November soared by a near record 109K to 733,000 from a downward revised 624,000 in October (from 685,000 previously).
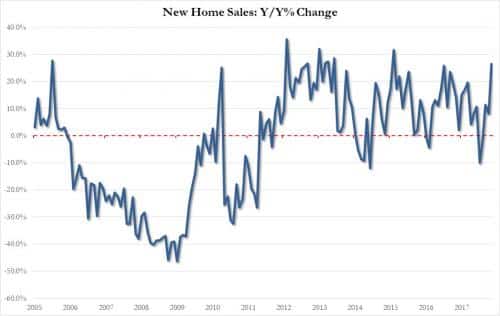
On a year over year basis, new home sales soared by a whopping 26.6%:
This was not only a 9-sigma beat to consensus expectations of 655K, but a monthly percentage basis, it was also the biggest monthly increase since January 1992 (that said, the previous 3 months were revised lower by 77,000.)
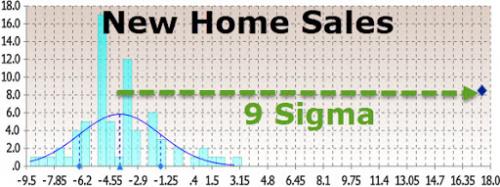
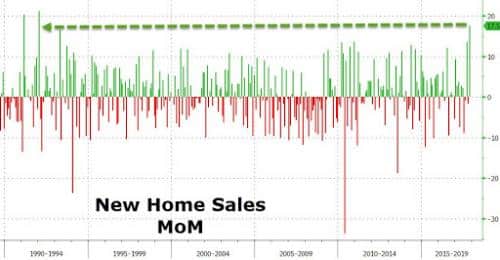
Broken down geographically, every single region saw an increase, although the biggest surge by far was in the West, where new home sales jumped by a whopping 31% M/M:
- Northeast: 9.5%
- Midwest: 6.9%
- South: 14.9%
- West: 31.1%
Some other observations:
- Median new home price rose 1.2% y/y to $318,700; average selling price at $377,100
- 15% of new homes sold in Nov. cost more than $500,000, down from 16% last month
- New home sales on pace for 613k this year compared to a 2016 total of 561k
- Houses for sale in Nov. unchanged at 283,000
- Months’ supply at 4.6 in Nov. compared to 5.4 last month
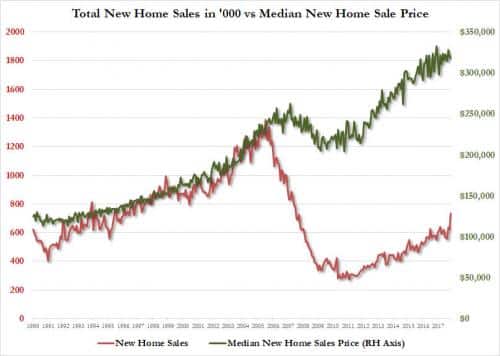
Still, as the chart below shows, new home sales have a way to go before they catch up to where median new home prices suggest sales should be.
